Are we in a shifting real estate market or what?

When looking at real estate metrics, it's important to understand how they correlate with each other as a way to gauge the current state of the market. For both buyers and sellers, these metrics can provide valuable insights into the supply and demand dynamics, as well as pricing trends. Let's dive into the correlation between the following real estate metrics to help you make informed decisions.
First, let's look at the Months Supply of Inventory, which stands at 1.95. This metric represents the number of months it would take to sell all the current inventory on the market, given the current sales pace. A lower number indicates a seller's market, where demand exceeds supply and properties tend to sell quickly.

The 12-Month Change in Months of Inventory is +50%. This metric shows the percentage change in the months of inventory compared to the previous year. In this case, the increase suggests that there is more inventory available compared to the previous year, potentially indicating a shift towards a buyer's market.
Next, we have the Median Days Homes are On the Market, which is just 13. This metric measures the average number of days it takes for a property to sell. A lower number indicates high demand and a faster sales process, which is great news for sellers.

Moving on to the List to Sold Price Percentage, which is 102%. This metric represents the percentage of the listing price at which properties are actually sold. A value above 100% suggests that properties are selling above their listed prices, indicating a competitive market and potentially multiple offer situations.
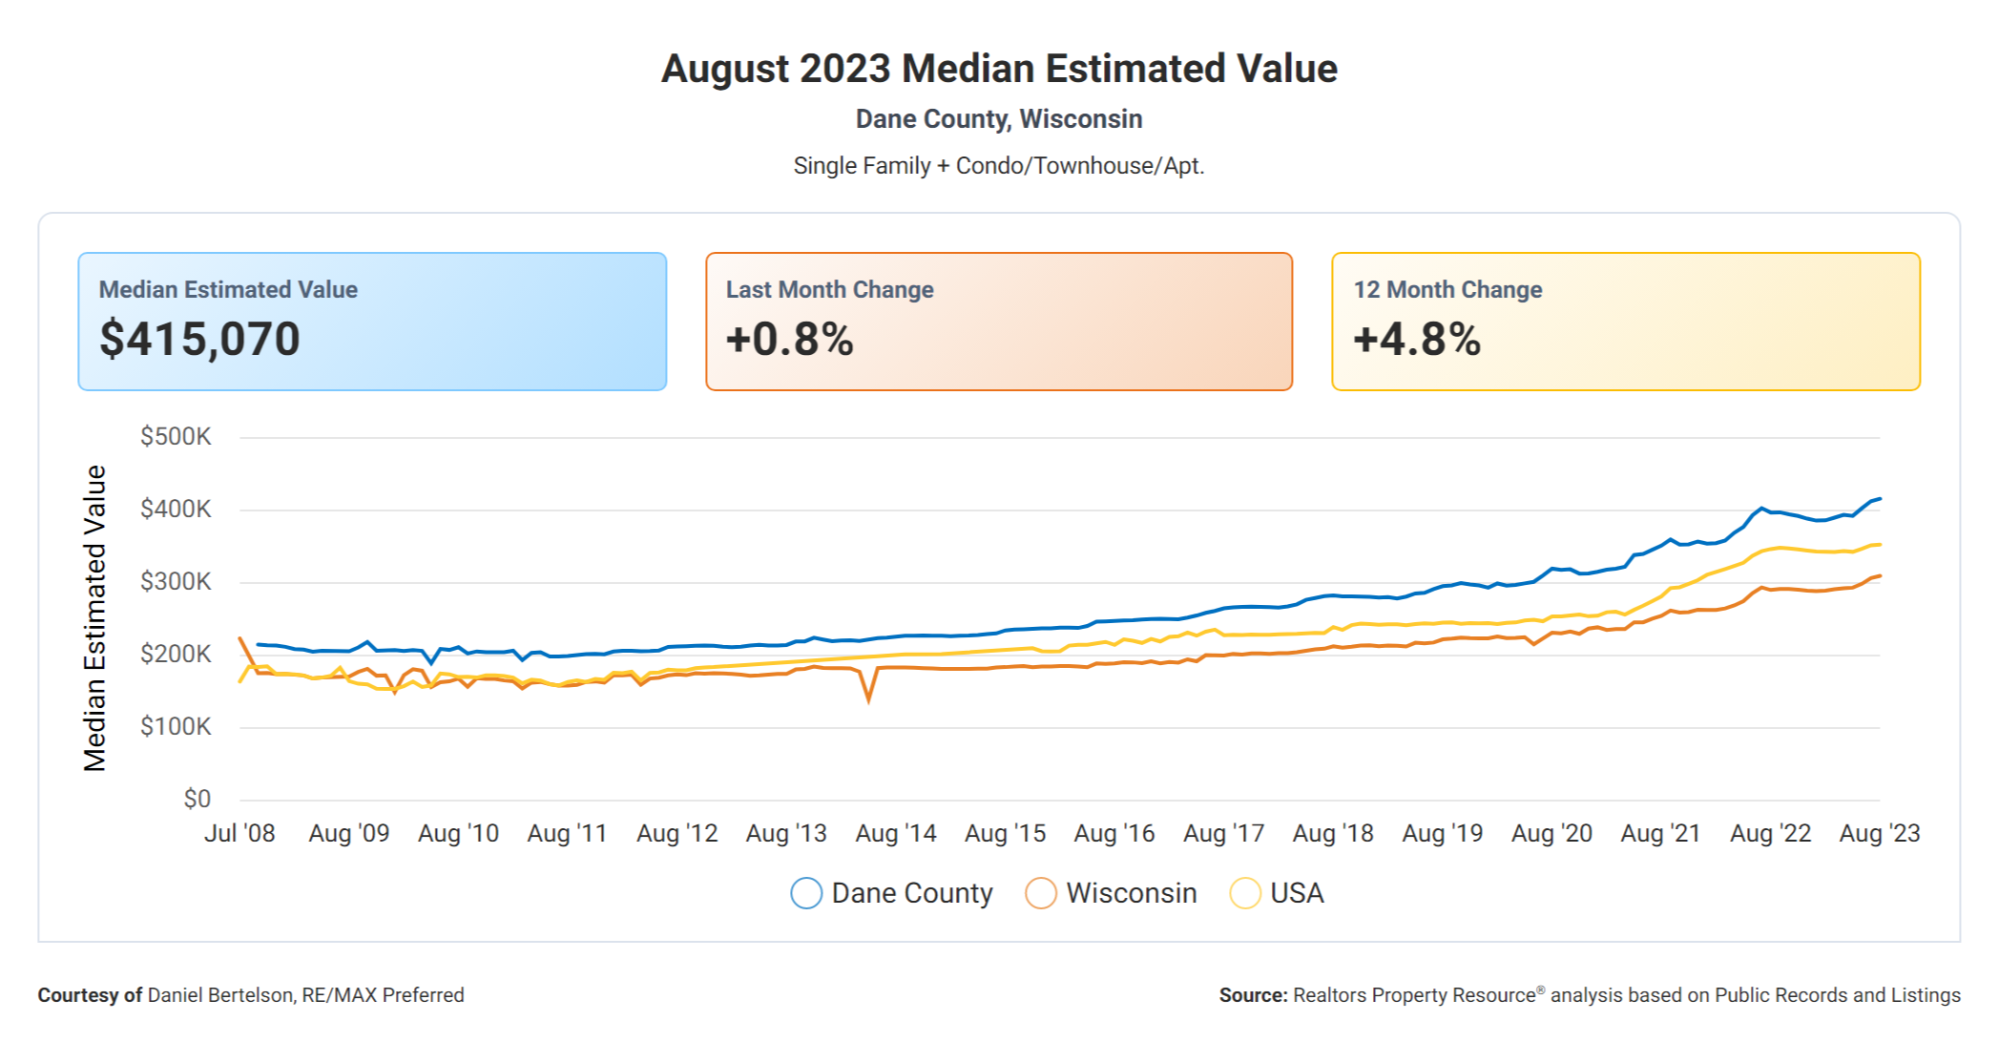
Lastly, we have the Median Sold Price, which stands at $413,577. This metric represents the middle price point of all the properties sold in the given time period. It provides a snapshot of the market's pricing trends and can help both buyers and sellers understand the range of prices they can expect.

Now, let's connect the dots. With a low Months Supply of Inventory and a Median Days Homes are On the Market of only 13 days, it's clear that there is high demand for properties in this market. The List to Sold Price Percentage of 102% further supports this, indicating that buyers are willing to pay above the listed prices to secure their desired properties.
However, the 12-Month Change in Months of Inventory, which increased by 50%, suggests that there is more inventory available compared to the previous year. This could potentially indicate a shift towards a buyer's market, providing buyers with more options and potentially more negotiating power.
Taking all these metrics into consideration, it's evident that there is a strong market for both buyers and sellers. Sellers can benefit from the high demand, fast sales process, and the potential for properties to sell above the listed price. On the other hand, buyers may find more inventory available and potentially more room for negotiation.
In conclusion, the correlation between these real estate metrics indicates a dynamic and competitive market. Both buyers and sellers should stay informed about these metrics as they navigate the real estate landscape to make the most informed decisions.
Categories
- All Blogs (392)
- Community Information (4)
- Featured Local Business (2)
- home improvements (4)
- home maintenance (3)
- home tips (7)
- Housing Market (4)
- housing stats (1)
- Inflation (1)
- Market Update (3)
- Mortgage (1)
- outdoor home space (1)
- Professional Services (2)
- Real Estate Advice (2)
- Real Estate Property Listings (1)
- value add (2)
Recent Posts


