Inventory begins to rise but still historically low

As potential buyers and sellers in the real estate market, it is crucial for you to understand the correlation between various metrics that shape the industry. Today, we will delve into the relationship between the months supply of inventory, the 12-month change in months of inventory, median days homes are on the market, list to sold price percentage, and the median sold price.
Let's begin with the months supply of inventory, which currently stands at 1.83. This metric represents the number of months it would take to sell all the homes on the market if no new listings were added. A lower months supply of inventory indicates a seller's market, where demand outpaces supply, leading to potentially higher prices.

Now, turning our attention to the 12-month change in months of inventory, we observe a significant increase of 30.71%. This suggests that the market has experienced an influx of new listings and an increase in inventory. It could indicate a shift towards a buyer's market, where supply surpasses demand, potentially leading to more competitive pricing and negotiation power for buyers.
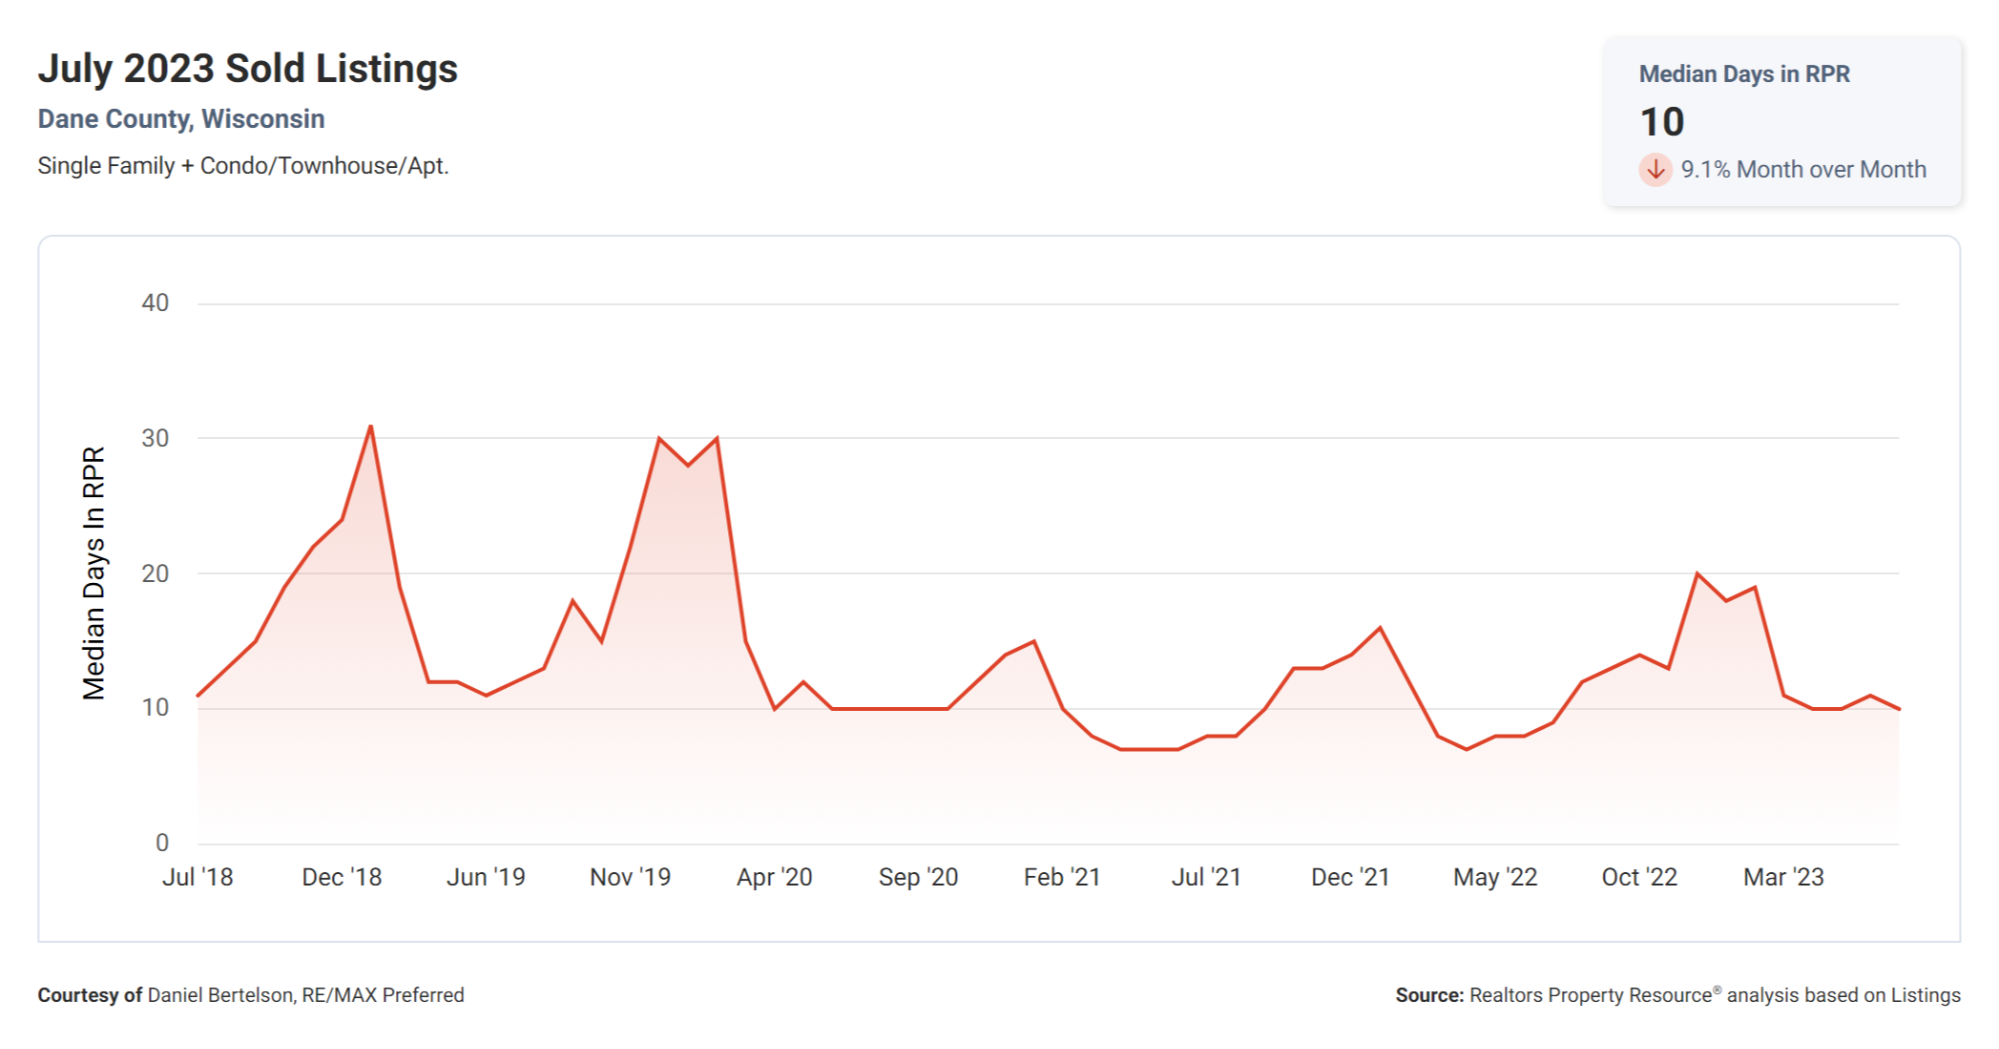
Moving on to the median days homes are on the market, we see a remarkably low figure of just 10 days. This short duration indicates a fast-paced market where properties are being snatched up quickly. Coupled with a low months supply of inventory, it underlines the high demand and competitiveness that exists in the current real estate landscape.
Next, we explore the list to sold price percentage, which sits at an impressive 102.9%. This metric signifies that, on average, homes are selling above their list price. It indicates strong buyer interest and competition, leading to bidding wars and potentially driving up prices. For sellers, this metric suggests the potential for higher returns on their properties.
Lastly, we examine the median sold price, which stands at $418,421. This figure represents the middle point of all the sold properties in the given market. It helps gauge the overall pricing trend and provides insight into the affordability and desirability of a particular area.

In summary, the correlation between these real estate metrics showcases a market with a low months supply of inventory, a significant increase in inventory over the past year, homes selling rapidly, properties consistently selling above their list price, and a median sold price of $418,421. These indicators collectively demonstrate a robust and competitive real estate market that favors both buyers and sellers, offering opportunities for quick sales and potentially higher returns on investments.
As you navigate the real estate market, understanding these correlations and trends will empower you to make informed decisions and seize favorable opportunities. Whether you are buying or selling, this knowledge will enable you to navigate the market successfully and achieve your desired outcomes.
Thank you for your attention, and of course discussing the current market conditions in person while taking into consideration your exact property will be much more helpful, never hesitate to call the Preferred Homes Team at RE/MAX.
*Statistics are based on data supplied to the South Central WI MLS by its Participants. The MLS and RE/MAX Preferred does not guarantee and is not responsible for their accuracy. Data maintained by the MLS does not reflect all real estate activity in the market.
Categories
- All Blogs (392)
- Community Information (4)
- Featured Local Business (2)
- home improvements (4)
- home maintenance (3)
- home tips (7)
- Housing Market (4)
- housing stats (1)
- Inflation (1)
- Market Update (3)
- Mortgage (1)
- outdoor home space (1)
- Professional Services (2)
- Real Estate Advice (2)
- Real Estate Property Listings (1)
- value add (2)
Recent Posts